Difference between revisions of "Template Tables"
| Line 27: | Line 27: | ||
| Time Butterfly || | | Time Butterfly || | ||
|- | |- | ||
| − | | | + | | <span style="font-size:85%">View Acutal and Forecast, over multiple Time periods.</span>|| |
|- | |- | ||
| − | | [[Image:ButterflyTable.png|350px|centre]] || | + | | [[Image:ButterflyTable.png|350px|centre]] || |
|} | |} | ||
Revision as of 11:32, 30 November 2020
Template tables allow you to easily add predefined tables that have usefuly metrics and formatting built into them. These can be used directly or further customised for your specific needs.
Contents
[hide]General features
The tables can be built on top of a cube or Pivot View which allows calculations to be built into the column definitions, and for users to drill down on the row members.
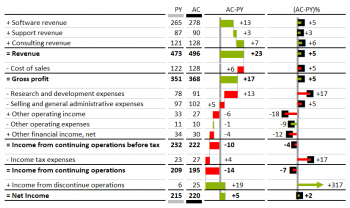
Columns can be formatted with standard number styles, or be displayed as in-cell charts for simple visualisation.
IBCS formatting can be applied to indicated data categories like Actual, Plan and Forecast.
It is very useful (but not essential) to define Business Rules in your workbook. When these are found the template will automatically be populated with usedful defaults, and a table can be build with just a few selections. The templates use the same rules as Business Charts.
Built in templates
| IBCS Table 1 | IBCS Table 2 |
| Compare Actuals to Plan and Previous Year, for Current Month and YTD. | Compare Actuals to Previous Year, with incell charts, for Current Month and YTD. |
| IBCS Table 3 | IBCS Table 4 |
| Compare Plan to Acutal or Forecast, over multiple Time periods. | Compare Account Actuals to Previous Year or Plan, with waterfall and percentage deltas. |
| Time Butterfly | |
| View Acutal and Forecast, over multiple Time periods. | |


