Difference between revisions of "Small Multiple Charts based on Excel Ranges"
(Created page with "From v7.5, XLCubed has the ability to create Small Multiple Charts from data found on your Excel worksheet. To insert a new chart: # Select the {{Menu|XLCubed|Insert|Small M...") |
m (Text replacement - "XLCubed" to "FluenceXL") |
||
| (One intermediate revision by one other user not shown) | |||
| Line 1: | Line 1: | ||
| − | From v7.5, | + | From v7.5, FluenceXL has the ability to create [[Small Multiple Charts]] from data found on your Excel worksheet. To insert a new chart: |
| − | # Select the {{Menu| | + | # Select the {{Menu|FluenceXL|Insert|Small Multiples|Excel...}} ribbon item |
# Select the data source, if it has not already been selected for you [[File:SMCRange1.png]] [[File:SMCRange2.png]] | # Select the data source, if it has not already been selected for you [[File:SMCRange1.png]] [[File:SMCRange2.png]] | ||
# Tick the {{Menu|Read data in hidden cells}} option if you would like all rows to be charted, whether they are visible or not | # Tick the {{Menu|Read data in hidden cells}} option if you would like all rows to be charted, whether they are visible or not | ||
| − | # | + | # FluenceXL will then insert an empty chart for you, ready for your columns selections |
# In this example, we can then drag {{Code|MonthName}} to Categories, {{Code|Category}} to Columns and {{Code|Color}} to Rows to give this chart: [[File:SMCRange3.png]] | # In this example, we can then drag {{Code|MonthName}} to Categories, {{Code|Category}} to Columns and {{Code|Color}} to Rows to give this chart: [[File:SMCRange3.png]] | ||
| Line 10: | Line 10: | ||
* There is no Header area: the charts are always based on the entire data set | * There is no Header area: the charts are always based on the entire data set | ||
* Any numeric column can be selected for the Y Axis values. When appropriate, this also applies to X Axis and Colour values. | * Any numeric column can be selected for the Y Axis values. When appropriate, this also applies to X Axis and Colour values. | ||
| + | * To edit the range, you may click the {{Menu|Select data source}} toolbar button in the Task Pane: [[File:SelectExcelRangeIcon.png]] | ||
| + | * To quickly change whether hidden data should be included in the chart, you can use the {{Menu|Read data in hidden cells}} toolbar button in the Task Pane: [[File:IncludeHiddenData.png]] | ||
==See Also== | ==See Also== | ||
* [[Small Multiple Charts]] | * [[Small Multiple Charts]] | ||
| + | * [[Small Multiple Charts based on SQL]] | ||
[[Category:Small Multiple Charts]] | [[Category:Small Multiple Charts]] | ||
Latest revision as of 15:50, 3 July 2023
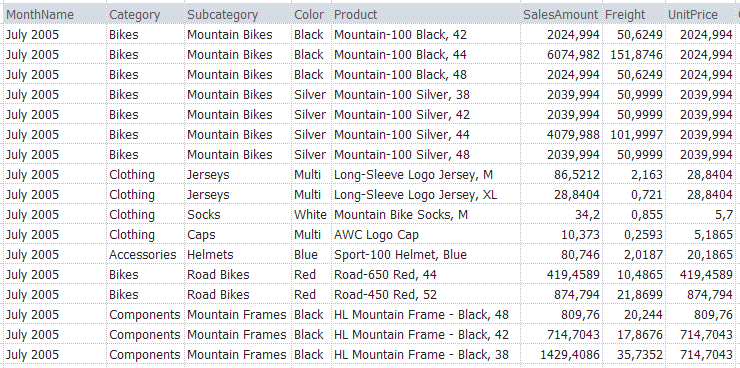
From v7.5, FluenceXL has the ability to create Small Multiple Charts from data found on your Excel worksheet. To insert a new chart:
- Select the FluenceXL > Insert > Small Multiples > Excel... ribbon item
- Select the data source, if it has not already been selected for you
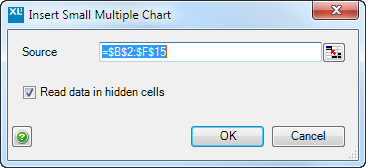
- Tick the Read data in hidden cells option if you would like all rows to be charted, whether they are visible or not
- FluenceXL will then insert an empty chart for you, ready for your columns selections
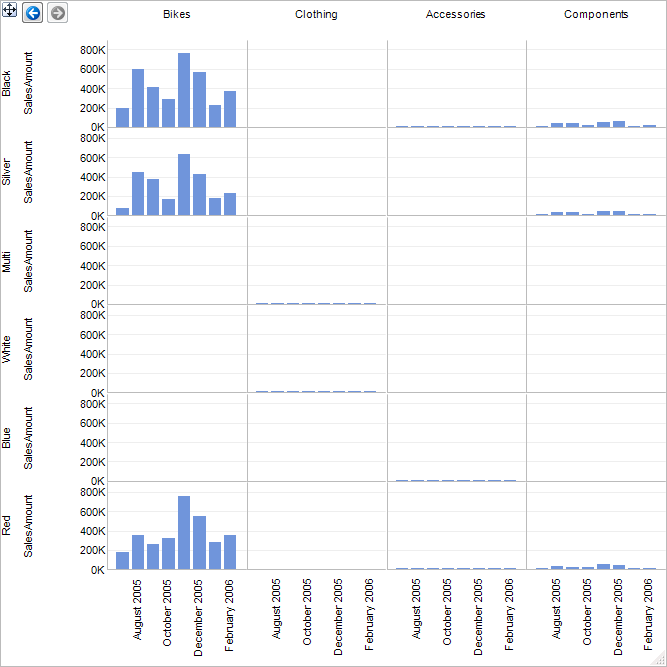
- In this example, we can then drag MonthName to Categories, Category to Columns and Color to Rows to give this chart:


These small multiple charts are identical to the Analysis Services based charts described on the Small Multiple Charts page, except for a few differences:
- There is no Header area: the charts are always based on the entire data set
- Any numeric column can be selected for the Y Axis values. When appropriate, this also applies to X Axis and Colour values.
- To edit the range, you may click the Select data source toolbar button in the Task Pane:

- To quickly change whether hidden data should be included in the chart, you can use the Read data in hidden cells toolbar button in the Task Pane:
