Difference between revisions of "Chart Label value from Range"
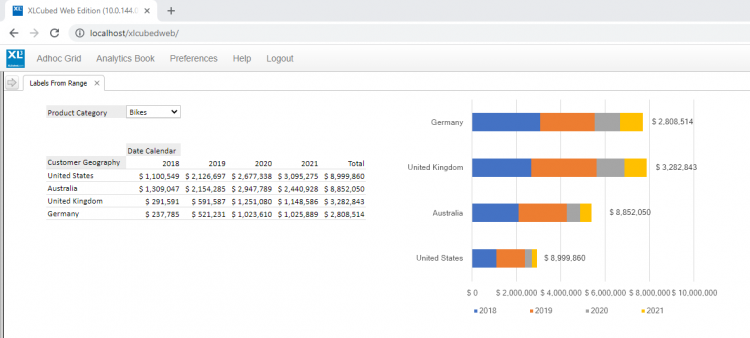
(Created page with "The capacity to set Excel chart label from a range in now supported in XLCubed Web Edition. This can be used to add totals to stacked bar charts. File:Labels from Range.png...") |
m (Text replacement - "XLCubed" to "FluenceXL") |
||
| (5 intermediate revisions by one other user not shown) | |||
| Line 1: | Line 1: | ||
| − | The capacity to set Excel chart label from a range | + | ;The capacity to set Excel chart label from a range is supported in FluenceXL Web Edition.<br> |
| − | This can be used to add totals to stacked bar charts. | + | ;This can be used to add totals to stacked Excel bar charts. |
[[File:Labels from Range.png|750px|center]] | [[File:Labels from Range.png|750px|center]] | ||
| Line 11: | Line 11: | ||
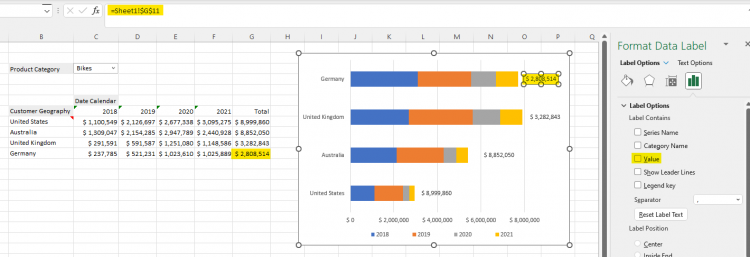
; Turn off the value in the label formatting | ; Turn off the value in the label formatting | ||
[[File:Label range value.png|750px|center]] | [[File:Label range value.png|750px|center]] | ||
| + | |||
| + | The chart and the total label will now update with your data. | ||
[[Category:Grid Reporting]] | [[Category:Grid Reporting]] | ||
[[Category:Visualisations]] | [[Category:Visualisations]] | ||
Latest revision as of 16:31, 3 July 2023
- The capacity to set Excel chart label from a range is supported in FluenceXL Web Edition.
- This can be used to add totals to stacked Excel bar charts.
Example Setup
- Create the Excel chart from your data as normal
- Add Data labels
- Turn off the labels except for the last series
- Click on the label and directly type in "=" and select the cell that contains the total
- Turn off the value in the label formatting
The chart and the total label will now update with your data.

