Difference between revisions of "Multidimensional Table Designer"
m (Text replacement - "XLCubed" to "FluenceXL") |
|||
| (One intermediate revision by one other user not shown) | |||
| Line 1: | Line 1: | ||
== Introduction == | == Introduction == | ||
| − | This designer allows you to create an | + | This designer allows you to create an FluenceXL [[Tables|table]] from an Analysis Services cube. This can be useful for list style reporting. |
When compared to [[Grids|grids]], these reports are easier for new users to create, but offer less functionality and interactivity. | When compared to [[Grids|grids]], these reports are easier for new users to create, but offer less functionality and interactivity. | ||
| Line 12: | Line 12: | ||
[[Image:MultidimensionalTableDesigner.png|thumb|center|500px]] | [[Image:MultidimensionalTableDesigner.png|thumb|center|500px]] | ||
| + | |||
| + | [[Image:MultidimensionalTableResults.png|thumb|center|500px]] | ||
Latest revision as of 09:27, 4 July 2023
Introduction
This designer allows you to create an FluenceXL table from an Analysis Services cube. This can be useful for list style reporting.
When compared to grids, these reports are easier for new users to create, but offer less functionality and interactivity.
Designer
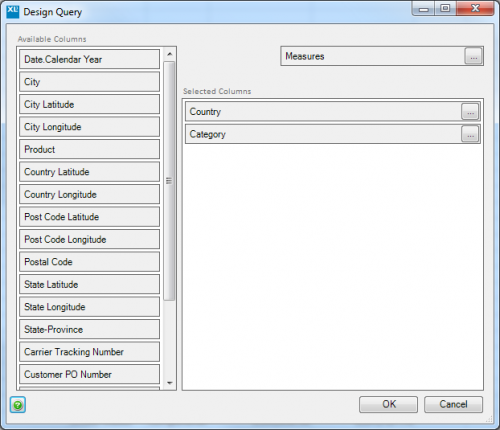
After selecting a cube to report on, you will be presented with a simple designer with three areas.
On the left is a list of the hierarchies in the cube. There can be dragged to the center section to include them as a column in the table. Individual members can be picked to restrict the rows returned.
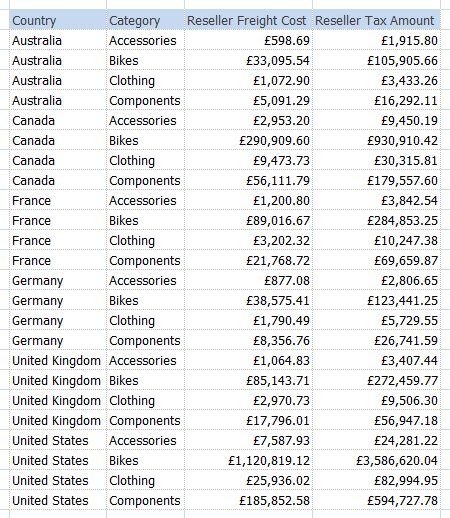
Finally the Measures section allows you to select the numbers you'd like to see for each row. These are displayed after the columns for the hierarchies.

