Difference between revisions of "Driving Grids from an Excel Range"
(→Example (based on the Bicycle Sales cube)) |
|||
| Line 8: | Line 8: | ||
# Insert a Grid based on the Bicycle Sales demo cube, starting from {{Code|A7}}. Select {{Code|Time}} and {{Code|Measures}} on Slicers, {{Code|Region}} on Columns and {{Code|Product}} on Rows. | # Insert a Grid based on the Bicycle Sales demo cube, starting from {{Code|A7}}. Select {{Code|Time}} and {{Code|Measures}} on Slicers, {{Code|Region}} on Columns and {{Code|Product}} on Rows. | ||
| − | # In cells {{Code|B3}} to {{Code|B5}}, we enter the years we want to analyse: | + | # In cells {{Code|B3}} to {{Code|B5}}, we enter the years we want to analyse:[[File:DrivingGridExample1.png|center|300px]] |
| − | |||
| − | |||
| − | |||
| − | |||
# To create a validation dropdown cell: | # To create a validation dropdown cell: | ||
#* Select the {{Code|B2}} cell for the dropdown | #* Select the {{Code|B2}} cell for the dropdown | ||
| − | #* Select the Data Validation ribbon item: | + | #* Select the Data Validation ribbon item: [[File:DrivingGridExample2.png|center|300px]] |
| − | + | #* Choose a '''List''' type validation, and enter {{Code|=$B$3:$B$5}} as the source:[[File:DrivingGridExample3.png|center|300px]] | |
| − | [[File:DrivingGridExample2.png|center|300px]] | + | #* Click '''OK''', and the dropdown will be created in cell {{Code|B2}}:[[File:DrivingGridExample4.png|center|300px]] |
| − | |||
| − | |||
| − | #* Choose a '''List''' type validation, and enter {{Code|=$B$3:$B$5}} as the source: | ||
| − | |||
| − | |||
| − | |||
| − | #* Click '''OK''', and the dropdown will be created in cell {{Code|B2}}: | ||
| − | |||
| − | |||
| − | |||
# Now we need to drive the Grid from the dropdown cell: | # Now we need to drive the Grid from the dropdown cell: | ||
#* Double-click on the {{Code|Time}} label to display the Hierarchy editor. | #* Double-click on the {{Code|Time}} label to display the Hierarchy editor. | ||
| − | #* Click on the '''Excel Range''' button, and choose {{Code|B2}} for the driving range: | + | #* Click on the '''Excel Range''' button, and choose {{Code|B2}} for the driving range:[[File:DrivingGridExample5.png|center|300px]] |
| − | + | #* The selected range is added to the list of selections: [[File:DrivingGridExample6.png|center|300px]] | |
| − | |||
| − | |||
| − | |||
| − | #* The selected range is added to the list of selections: | ||
| − | |||
| − | [[File:DrivingGridExample6.png|center|300px]] | ||
| − | |||
#* Click '''OK''' | #* Click '''OK''' | ||
| − | # The Grid will update to use the new range for the {{Code|Time}} hierarchy. Because the range is currently empty, the Grid seems to be unaffected, but if we now use the dropdown to switch the year to {{Code|2003}}, we'll see the Grid update: | + | # The Grid will update to use the new range for the {{Code|Time}} hierarchy. Because the range is currently empty, the Grid seems to be unaffected, but if we now use the dropdown to switch the year to {{Code|2003}}, we'll see the Grid update:[[File:DrivingGridExample7.png|center|300px]] |
| − | |||
| − | [[File:DrivingGridExample7.png|center|300px]] | ||
| − | |||
# As you can see, the validation list range can be hidden to keep the report tidy. | # As you can see, the validation list range can be hidden to keep the report tidy. | ||
# Even after drilling the Grid, the driving cell is still maintained: | # Even after drilling the Grid, the driving cell is still maintained: | ||
| − | |||
[[File:DrivingGridExample8.png|center|300px]] | [[File:DrivingGridExample8.png|center|300px]] | ||
Revision as of 16:19, 23 August 2012
For many standard reports, you will want to use data from the Excel workbook to influence your Grids. Driving dimensions from a range provides a simple way to do this, especially when multiple Grids need to use the same parameters.
If the input to the Grid can contain members that aren't found in the Cube, then the error message that is shown for invalid members can be hidden. See the Grid Properties Display error on invalid members option.
Example (based on the Bicycle Sales cube)
We will create a dropdown to automatically switch the Time dimension of our Grid.
- Insert a Grid based on the Bicycle Sales demo cube, starting from A7. Select Time and Measures on Slicers, Region on Columns and Product on Rows.
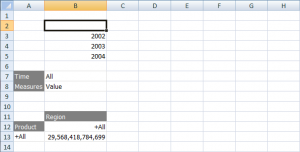
- In cells B3 to B5, we enter the years we want to analyse:
- To create a validation dropdown cell:
- Select the B2 cell for the dropdown
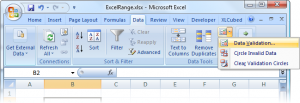
- Select the Data Validation ribbon item:
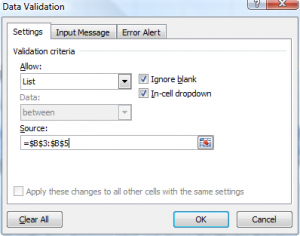
- Choose a List type validation, and enter as the source:
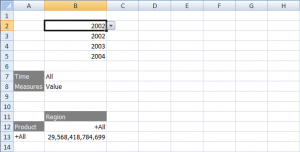
- Click OK, and the dropdown will be created in cell B2:
- Now we need to drive the Grid from the dropdown cell:
- Double-click on the Time label to display the Hierarchy editor.
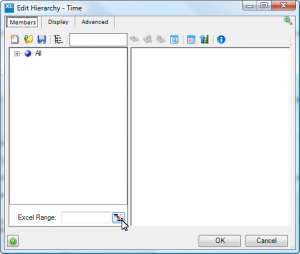
- Click on the Excel Range button, and choose B2 for the driving range:
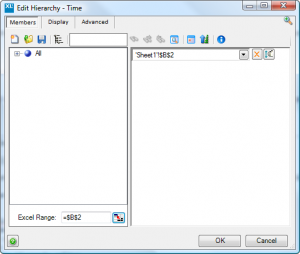
- The selected range is added to the list of selections:
- Click OK
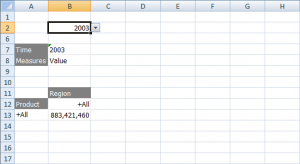
- The Grid will update to use the new range for the Time hierarchy. Because the range is currently empty, the Grid seems to be unaffected, but if we now use the dropdown to switch the year to 2003, we'll see the Grid update:
- As you can see, the validation list range can be hidden to keep the report tidy.
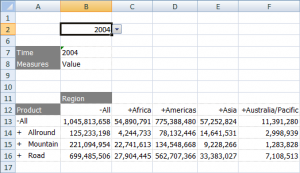
- Even after drilling the Grid, the driving cell is still maintained:
Further Exercises
- Drive a second hierarchy – perhaps the Product hierarchy
- Drive a second Grid from the same cell, and watch as both Grids change at once
- Drive the Grid from formulae
