Difference between revisions of "SparkPie Chart Designer"
(Created page with 'This dialog is used to format any SparkPie In-Cell Charts in your report. For details about how to invoke the dialog, see In-Cell Chart Designer. ==Chart Options== ; Title …') |
(Added See Also section (formula reference)) |
||
| (3 intermediate revisions by 2 users not shown) | |||
| Line 1: | Line 1: | ||
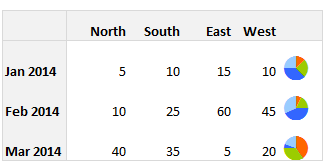
| + | [[Image:sparkpie.png|350px]] | ||
| + | |||
This dialog is used to format any SparkPie In-Cell Charts in your report. | This dialog is used to format any SparkPie In-Cell Charts in your report. | ||
| Line 8: | Line 10: | ||
; Colours 1 to 8 | ; Colours 1 to 8 | ||
: Specify the colours used for the pie sectors | : Specify the colours used for the pie sectors | ||
| + | |||
| + | ==See Also== | ||
| + | * [[XL3SparkPie]] formula | ||
[[Category:In-Cell Charts]] | [[Category:In-Cell Charts]] | ||
| + | [[Category:In-Cell Chart Designers]] | ||
Latest revision as of 10:43, 5 June 2015
This dialog is used to format any SparkPie In-Cell Charts in your report.
For details about how to invoke the dialog, see In-Cell Chart Designer.
Chart Options
- Title
- Specifies a title to place in the formula cell (for In-Cell Chart formulae), or to use as the member name (when used in Grids)
- Colours 1 to 8
- Specify the colours used for the pie sectors
See Also
- XL3SparkPie formula
