Difference between revisions of "Asymmetric Grids"
(Updated case of category) |
|||
| Line 1: | Line 1: | ||
==Asymmetric Grids== | ==Asymmetric Grids== | ||
| − | XLCubed has three quick select options on the right click menu for a grid. | + | XLCubed has three quick select options on the right click menu for a grid. ''Keep only'' retains just the highlighted members, while ''Keep all Except'' removes the highlighted members. The third option ''Exclude from Display'' allows for the creation of Asymmetric grids. |
For example you may want to display only budget for future months and only actuals for historic months. | For example you may want to display only budget for future months and only actuals for historic months. | ||
| − | To achieve this select the items which you want to remove, and on the right click menu select | + | To achieve this select the items which you want to remove, and on the right click menu select ''Exclude from Display''. |
| − | Note this is only applicable where there are two hierarchies on the axis, and the user must select elements from both hierarchies. In the example below | + | Note this is only applicable where there are two hierarchies on the axis, and the user must select elements from both hierarchies. In the example below ''January 2004'' is being excluded specifically for Australia. |
[[image:AsymGrids1.png|centre|500px]] | [[image:AsymGrids1.png|centre|500px]] | ||
Revision as of 16:59, 29 August 2012
Asymmetric Grids
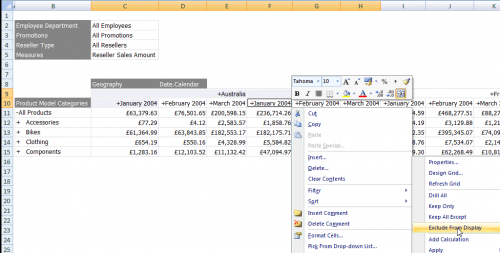
XLCubed has three quick select options on the right click menu for a grid. Keep only retains just the highlighted members, while Keep all Except removes the highlighted members. The third option Exclude from Display allows for the creation of Asymmetric grids.
For example you may want to display only budget for future months and only actuals for historic months.
To achieve this select the items which you want to remove, and on the right click menu select Exclude from Display.
Note this is only applicable where there are two hierarchies on the axis, and the user must select elements from both hierarchies. In the example below January 2004 is being excluded specifically for Australia.
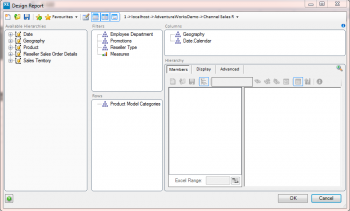
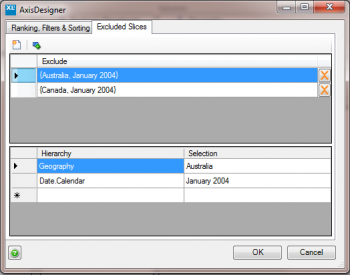
Excluded items can then be viewed, and deleted from the report designer via the information icon which appears on the relevant axis as shown below on columns.


