Difference between revisions of "Tabular"
(→Introduction) |
(→Introduction) |
||
| Line 3: | Line 3: | ||
In SQL Server 2012 Microsoft introduced the BI Semantic Model - "BISM". BISM encompasses the different deployment options for Business Intelligence within SQL Server 2012. The highest level choice is between Multi-dimensional Analysis Services and Tabular. Multi-dimensional is the latest incarnation of the hierarchical Analysis Services model which has been in widespread use since SQL Server 2000, and was heavily revised in SQL 2005 and 2008. Tabular is a new deployment option specific to SQL 2012 and based around tables rather than hierarchies. | In SQL Server 2012 Microsoft introduced the BI Semantic Model - "BISM". BISM encompasses the different deployment options for Business Intelligence within SQL Server 2012. The highest level choice is between Multi-dimensional Analysis Services and Tabular. Multi-dimensional is the latest incarnation of the hierarchical Analysis Services model which has been in widespread use since SQL Server 2000, and was heavily revised in SQL 2005 and 2008. Tabular is a new deployment option specific to SQL 2012 and based around tables rather than hierarchies. | ||
| − | MDX is the query language of hierarchical cubes, and continues to be used to query SQL 2012 Multi-dimensional. It can also be used to query Tabular models which have been deployed to the xVelocity (previously | + | MDX is the query language of hierarchical cubes, and continues to be used to query SQL 2012 Multi-dimensional. It can also be used to query Tabular models which have been deployed to the xVelocity (previously VertiPaq) in-memory engine within Analysis Services. So Tabular models which have been deployed this way can be queried by any MDX generating client tool (by and large anything which could connect to Analysis Services previously), or also through the DAX language. |
| − | Tabular models can also be deployed using Direct Query mode, but these can only be queried through DAX, and not MDX. In terms of the native client tools for SQL 2012, Pivot Tables use MDX, and PowerView uses DAX. To connect to all the BISM deployment modes you would need both Pivot Tables and | + | Tabular models can also be deployed using Direct Query mode, but these can only be queried through DAX, and not MDX. In terms of the native client tools for SQL 2012, Pivot Tables use MDX, and PowerView uses DAX. To connect to all the BISM deployment modes you would need both Pivot Tables and PowerView. XLCubed felt users would benefit from a consistent experience whichever flavour of BISM was being accessed, and so version 7 can query using MDX or DAX (with the new table object). The diagram below outlines this. |
[[Image:XLC2012.png|650px|centre]] | [[Image:XLC2012.png|650px|centre]] | ||
Revision as of 10:09, 1 May 2012
Contents
[hide]Introduction
In SQL Server 2012 Microsoft introduced the BI Semantic Model - "BISM". BISM encompasses the different deployment options for Business Intelligence within SQL Server 2012. The highest level choice is between Multi-dimensional Analysis Services and Tabular. Multi-dimensional is the latest incarnation of the hierarchical Analysis Services model which has been in widespread use since SQL Server 2000, and was heavily revised in SQL 2005 and 2008. Tabular is a new deployment option specific to SQL 2012 and based around tables rather than hierarchies.
MDX is the query language of hierarchical cubes, and continues to be used to query SQL 2012 Multi-dimensional. It can also be used to query Tabular models which have been deployed to the xVelocity (previously VertiPaq) in-memory engine within Analysis Services. So Tabular models which have been deployed this way can be queried by any MDX generating client tool (by and large anything which could connect to Analysis Services previously), or also through the DAX language.
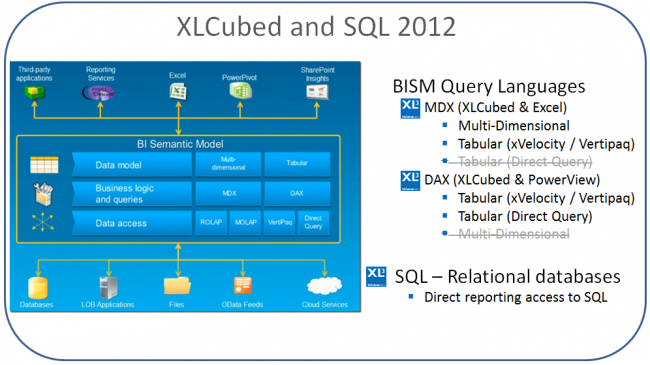
Tabular models can also be deployed using Direct Query mode, but these can only be queried through DAX, and not MDX. In terms of the native client tools for SQL 2012, Pivot Tables use MDX, and PowerView uses DAX. To connect to all the BISM deployment modes you would need both Pivot Tables and PowerView. XLCubed felt users would benefit from a consistent experience whichever flavour of BISM was being accessed, and so version 7 can query using MDX or DAX (with the new table object). The diagram below outlines this.
XLCubed can access these data sources using the existing Grid, Slicer and Formula functionality, and adds new functionality to allow reporting against these.
XLCubed accesses Tabular models using the DAX language, which can also be used to create your own cube calculations in the workbook.
Queries can be sent to cubes in either In-Memory (xVelocity) or Direct Query modes.
Grids
Grids can be used against In-Memory cubes, and all the standard XLCubed functionality can be accessed.
See the normal Analysis Services pages for information on how to use these features, they function consistently with Multidimensional cubes.
Tables
Tables provide a simple way of querying a tabular model. All of the standard functionality provided by XLCubed tables can be used.
Insert a table by going to the XLCubed ribbon and selecting Insert Data Table -> Analysis Services Tabular
This will allow you to select a connection to a Tabular cube, and bring up the report designer.
Slicers
Slicers give users simple to use pick lists which can be used to filter reports.
By adding a slicer based on Tabular Analysis Services you create a slicer that can be linked directly to a Table.
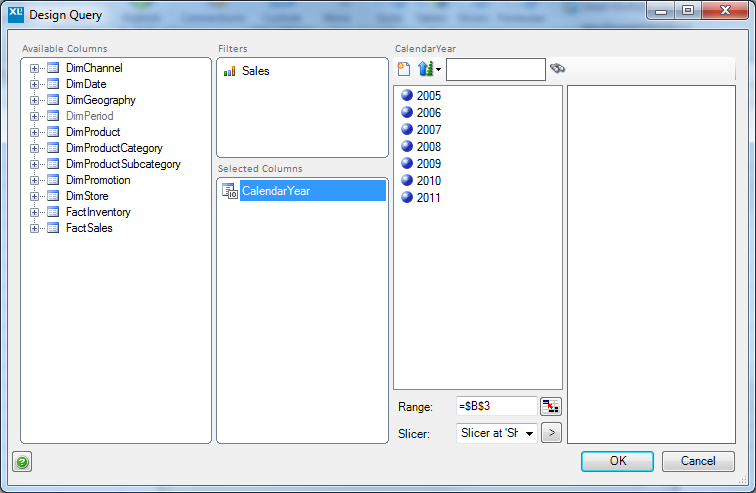
As with standard cube slicers, you can restrict the members shown to those with data by putting a measure into the Filters section.
The following slicer gives all the years for which there is Sales data.
Calculations
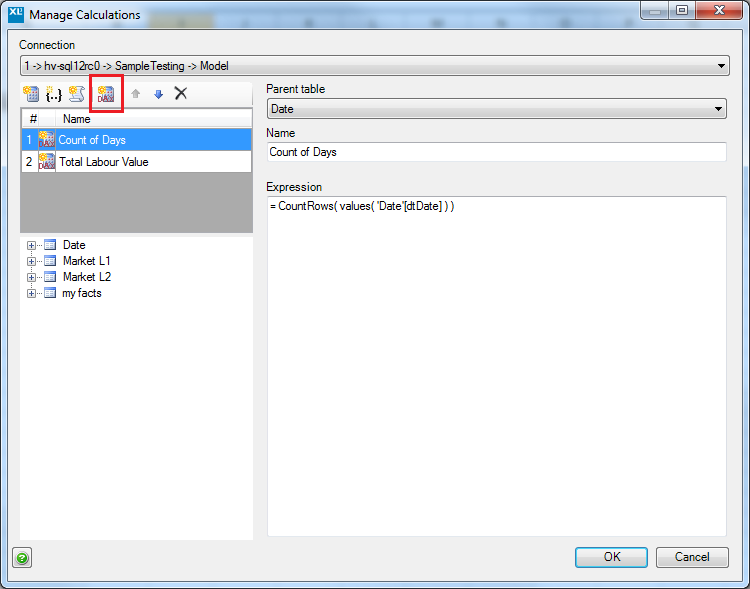
You can create new DAX calculations for your report without updating the cube.
These calculations are stored with the workbook, and are available from any grid, table or formula in the book.
Click the DAX button (highlighted) to create a new calculation, and then use the controls on the right to select
- Table the measure will appear in
- Name for the measure
- Formula to define the measure
You can drag tables, columns and measures from the tree on the left into the formula area to insert their names.
Formula
Please see the Tabular section of the formula reference.


