Difference between revisions of "Tables"
(→Performance tips for large tables) |
|||
| Line 156: | Line 156: | ||
[[Category:Tabular Reporting]] | [[Category:Tabular Reporting]] | ||
[[Category:Relational Reporting]] | [[Category:Relational Reporting]] | ||
| + | [[Category:SQL Getting Started]] | ||
| + | [[Category:DAX Getting Started]] | ||
Revision as of 09:37, 4 May 2012
Contents
[hide]Introduction
XLCubed tables can be inserted from several sources; multidimensional and tabular cubes, and SQL data sources.
Once the table has been inserted, several features are available which apply to all tables.
Properties
Please see the Table Properties page for more information.
Formatting
As with grids, formatting for tables is defined on the XLCubedFormats worksheet.
Tables will automatically pick up the default formatting for the column headers and data area.
In addition you can also define formats that will only apply to certain sections of the table.
Formatting Columns
You can format specific columns easily by right clicking the table and selecting "Format Column" or "Format Column Title" from the menu. This will show the formatting dialog, and automatically create the relevant rows in the format sheet.
This can also be done manually on the format sheet. To do this type the word "Column" as the column name, and then the name of the column.
You can the format the header and data areas. The following example makes the "Initial Agency Value" header bold, and uses currency formatting for the data.
Formatting Values
You can highlight specific values in a table by entering the column name and value, and setting the data cell format. The following example highlights December in red, and makes months starting with "A" bold.
Calculations
You can add your own calculated columns to an XLCubed table, which can contain any Excel formula.
To add a calculation, simple right click a column header and select "Add Calculation".
When you enter a calculation in the first cell, it will automatically "fill down". If the calculation references and columns in the table these will be stored as references to the column, so they will continue to work even if the columns are reordered.
In this example the total value is calculated from two columns retrieved, and the calculated column has been formatted as currency, as described in the formatting section.
Paging
If you have a large amount of data, it is often useful to display it in a series of pages. This is easily done with XLCubed tables.
The simplest way is to simply right click the table and select "Insert Pager".
Alternatively, go to the Slicer menu, and select "Insert data table pager". Right click the pager to configure which table you wish to page, and the page size, and click OK. This is useful when you want the pager to be on a different sheet to the table.
Sorting
Tables can easily be sorted by right-clicking a column header and selecting the sorting option.
You can sort by several columns by sorting them one after the other, and clear all sorting by selecting the appropriate menu item.
In the following example we sorted the "Initial Agency Value", and then the "Market Name". This gives a report with the Market names in sorted order, and within these the values are in ascending order.
Sections and Pivoting
These are two features that change the layout of a table from that returned by a query, making the result more useful for users. Repeating data can be eliminated, and layout improved (e.g. for charting).
Sections
Often one or more columns will repeat their value for many lines in the report. Often this is not useful information, and Sections can reduce this redundancy.
When you enable sections, column values will be written once as a header. As an example, take the following report.
The first market name is repeated a great deal, and does not add much value to the report. By going into the Table Properties screen, we can enable sections, and use one column in the header.
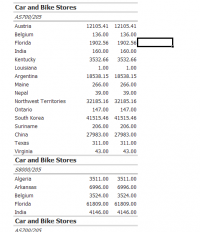
The result is as follows (The Market Name column has been configure to highlight in bold, using the standard formatting sheet).
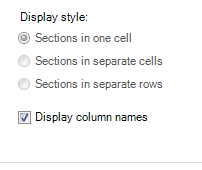
The style of the sections can be controlled using the Table Properties form.
- Sections in one cell
- Sections in separate cells
- Sections in separate rows
- Display column names
- Toggles the column name as part of the section.
Using a combination of sections and the format sheet, it is possible to produce a classic "Reporting Services" style report:
Pivoting
Pivoting a column takes the values for that column, and makes a new column for each.
For example, instead of having months going down, with one month on each row, we can pivot the column and have months go across the columns. The following example shows this in action.
One column for month names.
One column for each month.
Data source specific functionality
Depending on where the data for a table originated from there may additional options for interacting with the data.
SQL
- Edit Parameters
- Link the query parameters to Excel cells or slicers.
- Edit Connection Range
- Link the Connection String to a cell, allows driving the server or database from other parameters in the workbook.
Tabular Analysis Services
- Breakout (available from measure columns)
- Create a ranked list of the top or bottom values making up the number selected.
Performance tips for large tables
If you have very large tables, the following options will speed up data refreshes:
Turn off
- Apply Formatting
- Merge repeating cells
- Resize Columns


