Difference between revisions of "Treemaps"
| Line 8: | Line 8: | ||
In XLCubed treemaps can be sourced from a [[Tables|Table]], and Excel range or from a cube. | In XLCubed treemaps can be sourced from a [[Tables|Table]], and Excel range or from a cube. | ||
| + | |||
| + | =Data sources= | ||
| + | |||
| + | ==Table or Excel range== | ||
| + | |||
| + | The data sources for tables and Excel ranges are quite similar. | ||
| + | |||
| + | In both cases you select a number of columns. XLCubed will use the last two columns as the size and colour values to plot, and other columns provide the member values. | ||
| + | |||
| + | You can have several member columns, in which XLCubed will allow drill-down into the data. | ||
| + | |||
| + | ===Example=== | ||
| + | |||
| + | If we start with the following data in Excel: | ||
| + | |||
| + | [[Image:TreemapSampleData.png|thumb|450px|center]] | ||
| + | |||
| + | We can create the following treemap, which starts at the top level: | ||
| + | |||
| + | [[Image:TreemapRange1Level.png|thumb|450px|center]] | ||
| + | |||
| + | We can drill into the areas by double clicking to get more detail: | ||
| + | |||
| + | [[Image:TreemapRange1LevelDrilled.png|thumb|450px|center]] | ||
| + | |||
| + | ===Data options=== | ||
| + | |||
| + | If you edit the treemap, you get some options to customise it's behaviour. | ||
| + | |||
| + | The ''Show second level'' option allows you to instantly see the make up of each outer area from its children. For example, in the above example we see the product category, and how each sub-category contributes to it. Drill and we can see the products in a sub-category: | ||
| + | |||
| + | [[Image:TreemapRange2Level.png|thumb|450px|center]] | ||
| + | |||
| + | ==Cube== | ||
Revision as of 11:11, 19 July 2012
Treemaps are a new visualization available in V7.1 of XLCubed. They can show the relationship between two measures, and their variance across a dimension.
The above treemap plots Sales against Profit across the top ten states in the USA. In this example the size of the area represents the total sales, and the colour shows how profitable the sales in that area were.
In XLCubed treemaps can be sourced from a Table, and Excel range or from a cube.
Data sources
Table or Excel range
The data sources for tables and Excel ranges are quite similar.
In both cases you select a number of columns. XLCubed will use the last two columns as the size and colour values to plot, and other columns provide the member values.
You can have several member columns, in which XLCubed will allow drill-down into the data.
Example
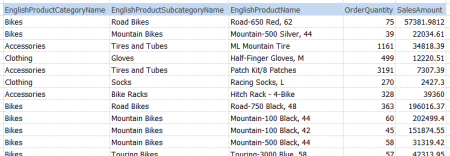
If we start with the following data in Excel:
We can create the following treemap, which starts at the top level:
We can drill into the areas by double clicking to get more detail:
Data options
If you edit the treemap, you get some options to customise it's behaviour.
The Show second level option allows you to instantly see the make up of each outer area from its children. For example, in the above example we see the product category, and how each sub-category contributes to it. Drill and we can see the products in a sub-category:


