Difference between revisions of "Analytics books"
| Line 13: | Line 13: | ||
Analytics book are made up of the report area on the left, and the designer on the right. | Analytics book are made up of the report area on the left, and the designer on the right. | ||
| − | [[Image:Analytics-StandardUI.PNG]] | + | [[Image:Analytics-StandardUI.PNG|450px|centre]] |
| − | ===Layout== | + | ===Layout=== |
In the designer you can drag and drop dimensions to set the layout of your report. | In the designer you can drag and drop dimensions to set the layout of your report. | ||
Revision as of 12:00, 28 June 2013
Analytics books were introduced in Version 7.5, and add give users the capability to create books on the web to slice, dice and visualise their data.
Contents
[hide]Creating a new book
To create a book simply click the button on the web toolbar.
You will be taken to the connection screen to select a cube, and choose the layout of the initial sheet in the book.
Standard UI
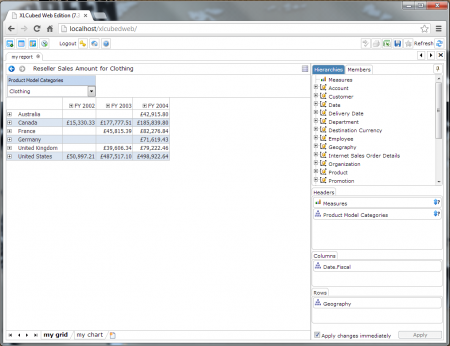
Analytics book are made up of the report area on the left, and the designer on the right.
Layout
In the designer you can drag and drop dimensions to set the layout of your report.
Dimensions in the Headers area display an extra icon. This allows you to switch between two modes when multiple members are selected:
- Slice - A drop down is displayed that allows you to chose which member is applied to the data.
- Total - The total for all the members selected is displayed.


