Difference between revisions of "Message Charts"
| Line 1: | Line 1: | ||
<span id="Variance" /> | <span id="Variance" /> | ||
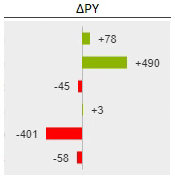
== Absolute Variance == | == Absolute Variance == | ||
| + | |||
| + | {| style="width:100%" | ||
| + | |- style="vertical-align:top;" | ||
| + | | style="width:305px" | [[File:MC_Variance.png|thumb|left]] || description | ||
| + | |} | ||
<span id="VariancePercentLolliplot" /> | <span id="VariancePercentLolliplot" /> | ||
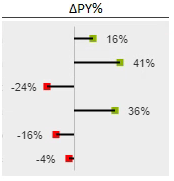
== Relative Variance (%) == | == Relative Variance (%) == | ||
| + | |||
| + | {| style="width:100%" | ||
| + | |- style="vertical-align:top;" | ||
| + | | description || style="width:305px" | [[File:MC_VariancePercentLolliplot.png|thumb|left]] | ||
| + | |} | ||
<span id="ValuesWithVarianceOffsetBar" /> | <span id="ValuesWithVarianceOffsetBar" /> | ||
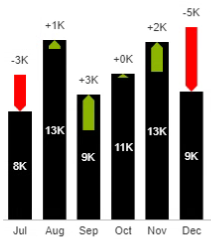
== Integrated Variance == | == Integrated Variance == | ||
| + | |||
| + | {| style="width:100%" | ||
| + | |- style="vertical-align:top;" | ||
| + | | style="width:305px" | [[File:MC_ValuesWithVarianceOffsetBar.png|thumb|left]] || description | ||
| + | |} | ||
<span id="ValuesWithVarianceArrow" /> | <span id="ValuesWithVarianceArrow" /> | ||
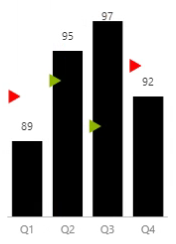
== Indicator Comparison == | == Indicator Comparison == | ||
| + | |||
| + | {| style="width:100%" | ||
| + | |- style="vertical-align:top;" | ||
| + | | description || style="width:305px" | [[File:MC_ValuesWithVarianceArrow.png|thumb|left]] | ||
| + | |} | ||
<span id="ValuesCompare" /> | <span id="ValuesCompare" /> | ||
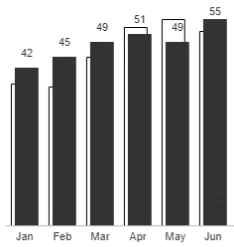
== Offset Comparison == | == Offset Comparison == | ||
| + | |||
| + | {| style="width:100%" | ||
| + | |- style="vertical-align:top;" | ||
| + | | style="width:305px" | [[File:MC_ValuesCompare.png|thumb|left]] || description | ||
| + | |} | ||
<span id="ValuesWithForecastTwoColumns" /> | <span id="ValuesWithForecastTwoColumns" /> | ||
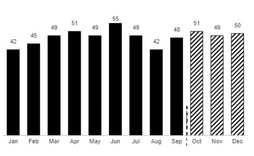
== Business Scenario == | == Business Scenario == | ||
| + | |||
| + | {| style="width:100%" | ||
| + | |- style="vertical-align:top;" | ||
| + | | description || style="width:305px" | [[File:MC_ValuesWithForecastTwoColumns.png|thumb|left]] | ||
| + | |} | ||
<span id="Waterfall" /> | <span id="Waterfall" /> | ||
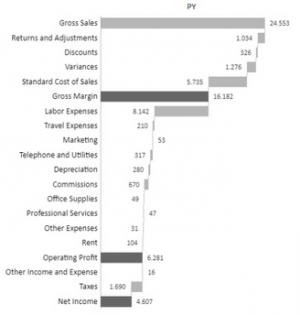
== Waterfall == | == Waterfall == | ||
| + | |||
| + | {| style="width:100%" | ||
| + | |- style="vertical-align:top;" | ||
| + | | style="width:305px" | [[File:MC_Waterfall.png|thumb|left]] || description | ||
| + | |} | ||
<span id="WaterfallPeriodComparison" /> | <span id="WaterfallPeriodComparison" /> | ||
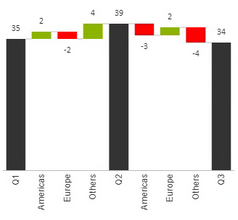
== Variance Waterfall == | == Variance Waterfall == | ||
| − | ===Outputting cells=== | + | {| style="width:100%" |
| + | |- style="vertical-align:top;" | ||
| + | | description || style="width:305px" | [[File:MC_WaterfallPeriodComparison.png|thumb|left]] | ||
| + | |} | ||
| + | |||
| + | ====Outputting cells==== | ||
If you have split by a different category hierarchy and want to output the category to excel then you can pick a range of two cells to put the values in. The first will contain the date member, the second the split-by member. | If you have split by a different category hierarchy and want to output the category to excel then you can pick a range of two cells to put the values in. The first will contain the date member, the second the split-by member. | ||
<span id="ValuesCompareLines" /> | <span id="ValuesCompareLines" /> | ||
== Trend Comparison == | == Trend Comparison == | ||
| + | |||
| + | {| style="width:100%" | ||
| + | |- style="vertical-align:top;" | ||
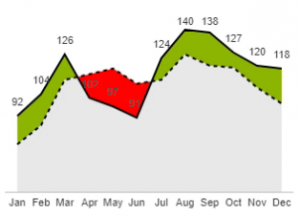
| + | | style="width:305px" | [[File:MC_ValuesCompareLines.png|thumb|left]] || description | ||
| + | |} | ||
<span id="ValuesCompareLinesCumulative" /> | <span id="ValuesCompareLinesCumulative" /> | ||
== Trend Comparison (Cumulative) == | == Trend Comparison (Cumulative) == | ||
| + | |||
| + | {| style="width:100%" | ||
| + | |- style="vertical-align:top;" | ||
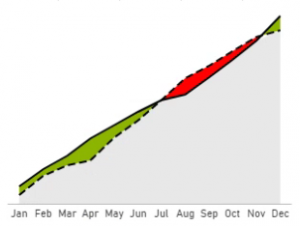
| + | | description || style="width:305px" | [[File:MC_ValuesCompareLinesCumulative.png|thumb|left]] | ||
| + | |} | ||
Revision as of 11:58, 10 March 2020
Contents
[hide]Absolute Variance
| description |
Relative Variance (%)
| description |
Integrated Variance
| description |
Indicator Comparison
| description |
Offset Comparison
| description |
Business Scenario
| description |
Waterfall
| description |
Variance Waterfall
| description |
Outputting cells
If you have split by a different category hierarchy and want to output the category to excel then you can pick a range of two cells to put the values in. The first will contain the date member, the second the split-by member.
Trend Comparison
| description |
Trend Comparison (Cumulative)
| description |
