Difference between revisions of "Grid Calculations"
(→Member Selector - Adhoc Groupings) |
(→Member Selector - Adhoc Groupings) |
||
| Line 32: | Line 32: | ||
| − | #Choose the members to group, and select group members | + | #Choose the members to group, and select group members. |
| − | #Then name the grouping as required, and choose the parent element which the group is to appear under | + | #Then name the grouping as required, and choose the parent element which the group is to appear under. |
[[image:GridCalc3.png|centre]] | [[image:GridCalc3.png|centre]] | ||
Revision as of 11:36, 2 June 2011
The Add Calculation option is available on the Grid's right mouse button pop-up menu.
For example, if you have the Time hierarchy on the columns and right click to add a Grid Calculation to Q2 you can add an additional Q2-Q1 delta column to the Grid. The column is inserted as an empty column to which you can add a title and formula. The formula can be typed into any of the cells, and will be propagated to all the other cells in the row or column automatically.
This column will be automatically refreshed as you drill or swap dimensions.
You can view or delete the inserted rows/columns on the XLCubed > Calculation > Manage Calculations form.
Contents
[hide]Video demonstration
Click here for videos showing grid calcualtions.
Examples (based on the Bicycle Sales cube)
We want to see the difference between 2004 and 2003 in a Grid.
- Insert a Grid based on the Bicycle Sales demo cube, with the Time hierarchy on columns
- Drill down Time's All member by double-clicking on B5:

- Right-click on 2004 (E5) and choose XLCubed > Add Calculation
- In the title cell (Calc, F5), type a name for the Calculation:
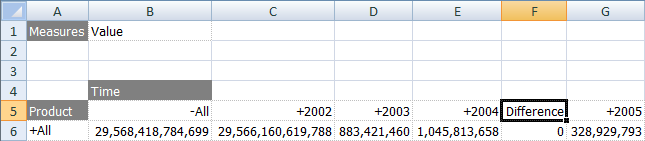
- In one of the column's data cells (for example, F6) type the formula for the Calculation, =E6-D6. You may need to resize the column:

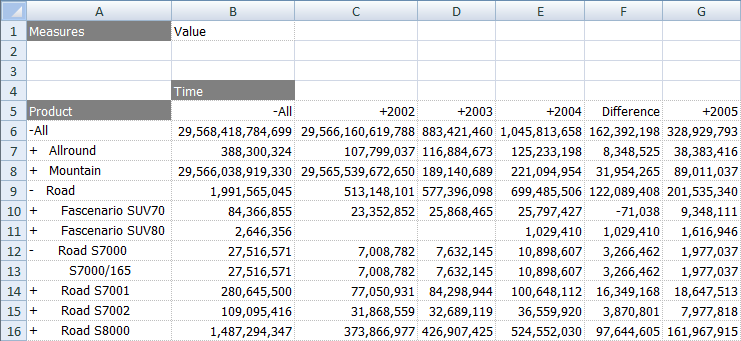
- The Grid Calculation column will now be used, even if the structure of the Grid is changed:


Member Selector - Adhoc Groupings
Users can quickly add custom groupings into their reporting, with the calculations then available for selection from the member selector across all grids and formulae sharing the same cube connection within the workbook. This is done on the right click menu in the member selector as shown below:


- Choose the members to group, and select group members.
- Then name the grouping as required, and choose the parent element which the group is to appear under.

For measures, users can add a calculation which will show percentage contribution to specific levels in a chosen hierarchy. This is available in the member selector for measures, on the right click menu as shown below.


In this example a calculation is added to show the Reseller sales amount as a percentage of the parent at the country level in the Geography hierarchy.
