DotPlot Chart Designer
Revision as of 10:21, 13 June 2012 by Csalter (talk | contribs) (Created page with "This dialog is used to format any Dotplot In-Cell Charts in your report. For details about how to invoke the dialog, see In-Cell Chart Designer. ==Chart Options== ; Length ...")
This dialog is used to format any Dotplot In-Cell Charts in your report.
For details about how to invoke the dialog, see In-Cell Chart Designer.
Chart Options
- Length
- The horizontal scale factor to use when drawing the chart
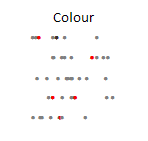
- Colour
- The colour to draw the plots
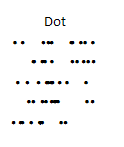
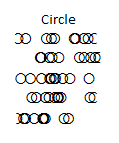
- Plot symbol
- There are two choices:
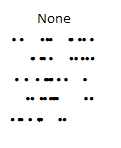
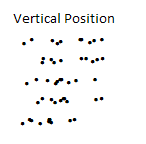
- Stacking type
- Based on the stacking type - the values will be grouped and drawn either varying the colour or the vertical position:
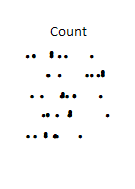
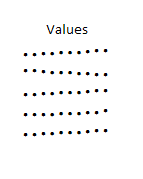
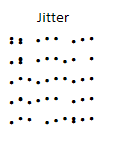
- Stacking value type
- Defines how dots are stacked - the number of values, an alternate set of values or a random jitter:
Colours
- Defines the Colours to use when stacking values
