Visual Totals
Contents
[hide]Overview
Visual Totals is a new Grid Property in Version 7.6 - once enabled any parent member will show the total for the members selected in the report.
For example:
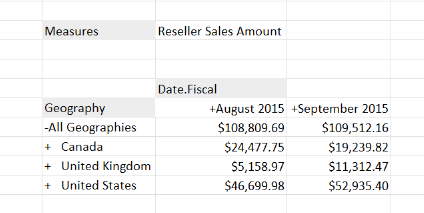
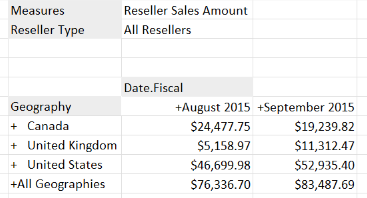
Without Visual Totals enabled:
The value for "All Geographies" is based on all the members in the cube.
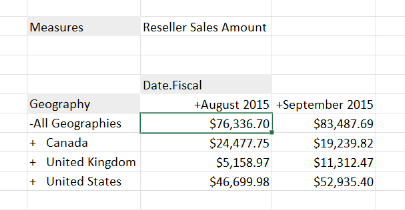
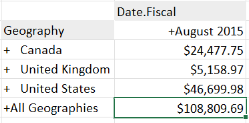
With Visual Totals enabled "All Geographies" is based on the selected members only "Canada", "United Kingdom" and "United States".
Restrictions
The order of the selected members is very important for how the totals are calculated.
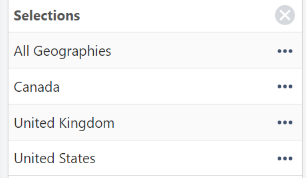
For the members to be totaled they must appear in the member selector with the highest member before the lower level members:
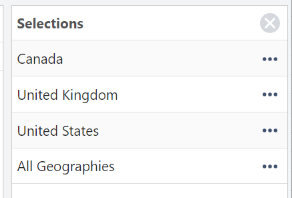
The following selections would total the members correctly to give the aggregate of the 3 countries:
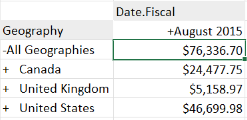
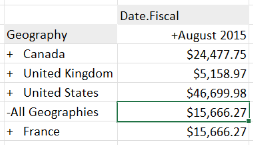
This example would display the real total for "All Geographies" as it appears underneath its children:
So the following example would give the total for France:
Visual totals are calculated before Sorting and Unions
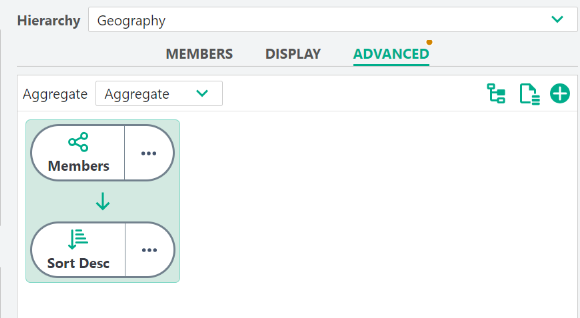
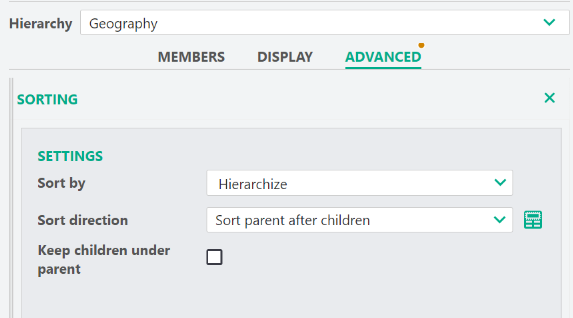
This means that if you want to display the Visual Total for "All Geographies", you can do this using the "Reverse" sort:
